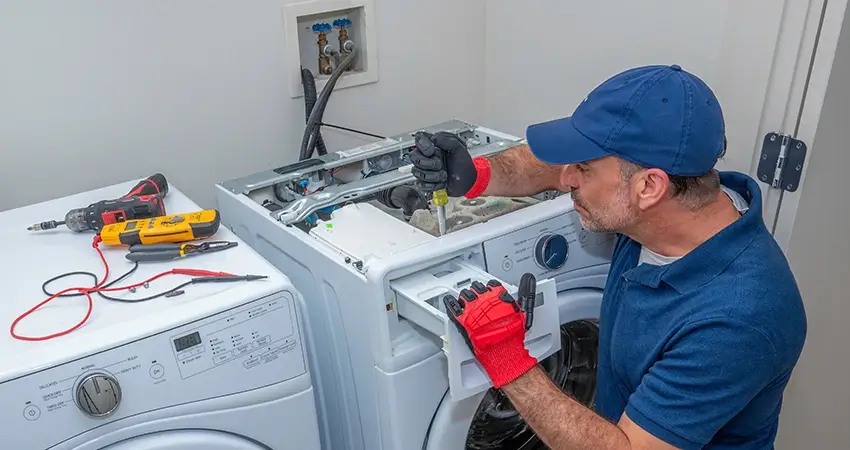
SEO Case Study: An LA Appliance Repair Company
Date of project: April & May, 2022
The Problem
An appliance repair company had an aging information site with around 150 pages. Traffic was steadily declining; year over year in March 2022, the site had lost 37.17% of its traffic, including 26.03% of organic traffic.
Only 5.78% of traffic came from the service area of Los Angeles. Blog pages were driving organic traffic, and more localized service pages ranked for very few keywords.
Tangled site navigation left visitors confused and some pages orphaned, and a site crawl revealed broken links, links to noindex pages, unoptimized headings and metadata, and other issues.
Service pages read like Wikipedia articles, failing to sell the service or offer a path to the contact page.
What We Did
- We rebuilt the site to improve page load speed, site architecture, and the user experience.
- We left global navigation intact but reorganized pages within site categories. Duplicate and superfluous service pages were moved to the blog section and rewritten.
- We rewrote or updated over 100 information and blog pages, adding headings, scannable text, calls to action, and bullet points. On service pages, we placed a service summary at the very top and gave visitors a “Contact Us” button to click.
- We retired poorly performing pages with no real keyword target.
- We consolidated pages with highly similar content.
- We built out and launched ≈20 blog pages that had been sitting unfinished for several years.
- We added service pages for essential areas of business, i.e., commercial refrigerator installation and repair.
- We tended to SEO basics: metadata, schema, redirects, etc.
The Results
The downward traffic trend had reversed within a month of the site launch. Within two months, site traffic was up by 28.20% from the pre-launch baseline.
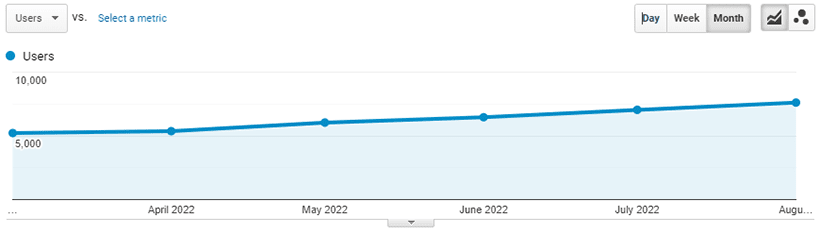
Organic traffic growth following the site redesign in April.
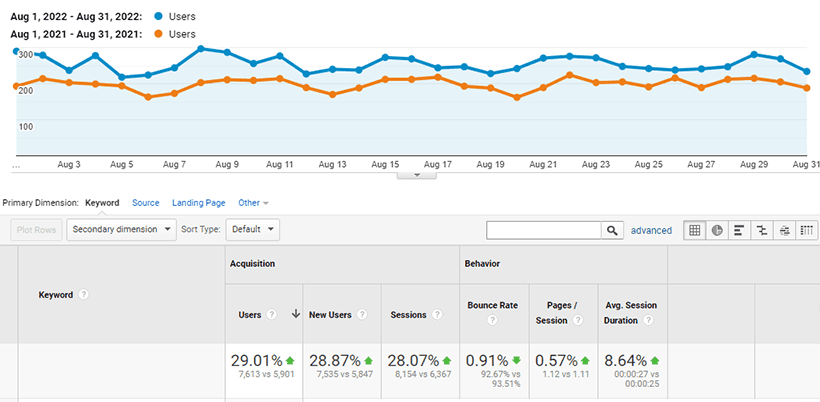
YOY organic traffic, sessions, and session duration for August.
Year-over-Year Data for August 2022 (4 Months after Launch)
-
- Organic traffic: +29.01%
- Organic bounce rate: -0.88%
- Pageviews: 17.92%
- Session duration: +18.57%
- Los Angeles visitors: +92.79%
Year-over-Year Data for December 2022 (8 Months after Launch)
-
- Organic traffic: +59.23%
- Organic bounce rate: -1.82%
- Pageviews: 65.00%
- Session duration: +35.20%
- Los Angeles visitors: +140.66%


